Measure selection
Select measures
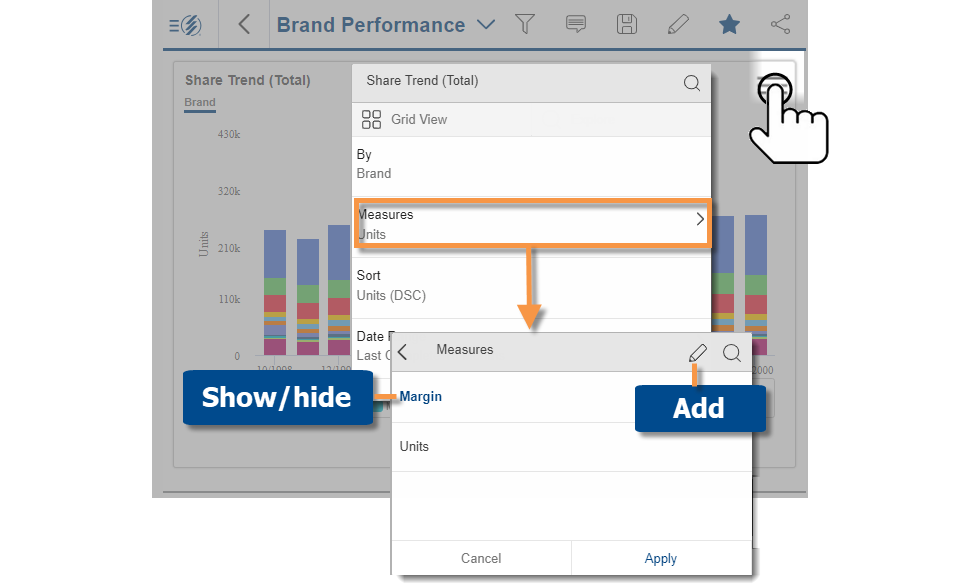
Tap on ![]() in upper-right corner of the widget, and then tap on Measures. The list includes measures that have been built into the widget. To show/hide any measure, tap on it. (blue text = show; regular text = hide)
in upper-right corner of the widget, and then tap on Measures. The list includes measures that have been built into the widget. To show/hide any measure, tap on it. (blue text = show; regular text = hide)
To add another measure, tap the  icon to select it from a list of all available measures, or tap
  to search for a measure.
|
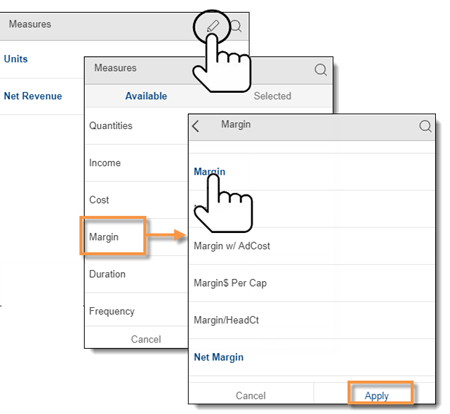
Option 1: Add a measure from a list |
|
|
|
|
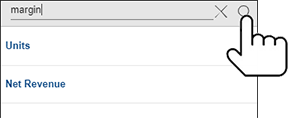
Option 2: Add a measure by searching |
|
|
 |
-
Tap on the measure; then Apply.
-
This takes you to a list of the selected measures. You can then apply your changes.
Tip: If you don't see the desired measure, it may not be available for the given context. For example:
• The available measures are limited to data cube(s) associated with the current Group By; therefore, you may need to change the data cube and 1st By (in the Group By area) to access a measure for a different activity or data source.
• The available members depend on the analysis type. For example, the mix widget is limited to additive data. Adding a measure to an exception widget makes that data available in lists of passing/failing members.
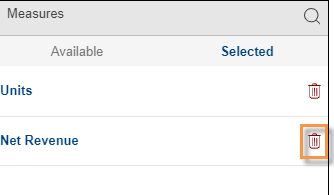
Delete a measure
Tap on in the Measures area and go to the Selected list. You can then delete any measure from the widget.
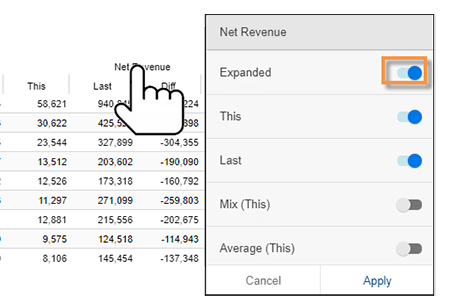
Expand a calculated measure
|
In a grid, you can expand a calculated measure to see its components. Tap the heading of the calculated measure. In the pop-up menu, turn on Expanded and then Apply. |
|
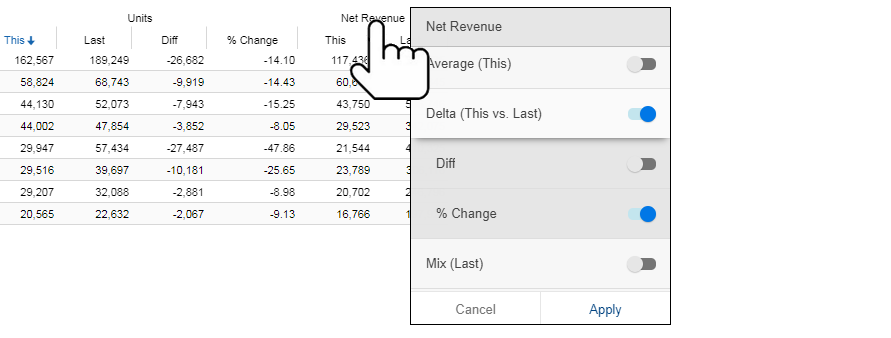
Variance and other computations
A grid can include difference, % change, mix, and other computations.
To show computations
-
In a grid, tap the measure heading.
-
In the pop-up menu, toggle the switches to show the desired columns; then tap on Apply.
|
Column |
Explanation |
|
This |
Values for the main date range (This) |
|
Last |
Values for the comparison date range (Last) |
|
Average |
Average per unit of time (per day, week, month, or period) in the date range. When comparing two date ranges, mix is available for This and/or Last. |
|
Mix |
Percent of the total. When comparing two date ranges, mix is available for This and/or Last. |
|
Delta (This vs. Last) |
Variance between date ranges (This vs. Last). This switch inserts difference and percent change. Optionally, turn off an underlying switch to show just one of these computations. |
|
Delta (Last vs. This) |
Variance between date ranges (Last vs. This) |
|
Delta (Mix (This) vs. Mix (Last)) |
Difference in mix between date ranges (This vs. Last) |
|
Delta (Mix (Last) vs. Mix (This)) |
Difference in mix between date ranges (Last vs. This) |
Tip: You cannot show a computation unless its components are already turned on. For example, to make Delta available, the widget must include This and Last. If the widget does not include the necessary columns: add them, apply changes, and then go back to the computation selection area.
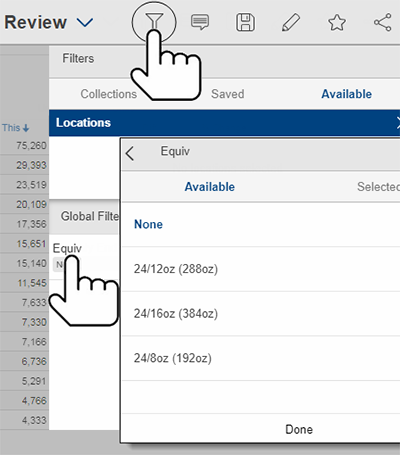
Equivalents
|
Equivalents are a way to standardize data so that all units are worth the same amount. For example, you might express volume in terms of ounces or another standard measurement. If an equivalent selector is pre-built into the dashboard, you can apply equivalents across the dashboard. This menu is located in the filter panel.
Tips: |
|