Group By
In widgets that compare members, data is grouped by attributes (i.e. Group By) to allow comparison and investigation of those groupings. Multiple levels of groupings may be available.
In this topic:
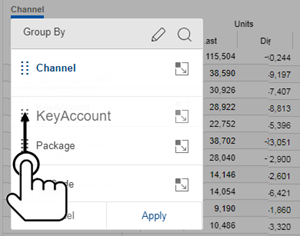
Select top-level groupings (1st By)
|
Select how to group the data at the highest level (1st By). The resulting groupings can be compared, ranked, and expanded. Tap the By (underlined in blue) in the breadcrumb path; then tap on an attribute in the Group By menu. This list of attributes is built into the dashboard. You can access more attributes for grouping the data if you wish. |
|
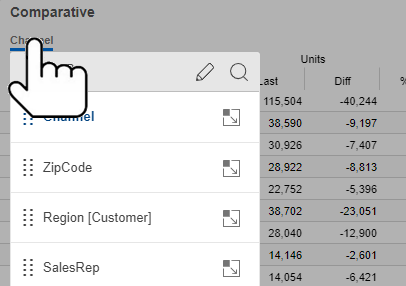
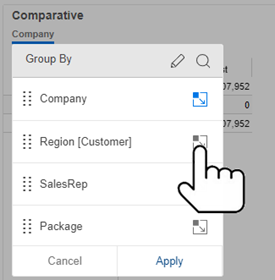
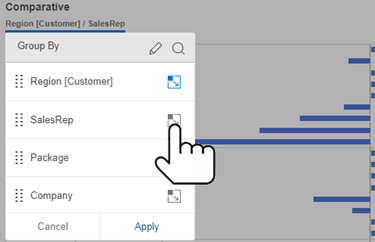
Select the Group By order (2nd By, 3rd By, etc.)
|
The Group By order controls what attribute is next when expanding a member or drilling down. To change the order: Tap the By (underlined in blue) in the the breadcrumb path Then, grab an attribute's After selecting the order, tap on Apply. |
|
Add an attribute for grouping the data
Option 1: Select from a list
Tip: The Group By area shows keys and attributes for the selected data cube (i.e., type of activity). You may need to change the cube to access other keys and attributes.
|
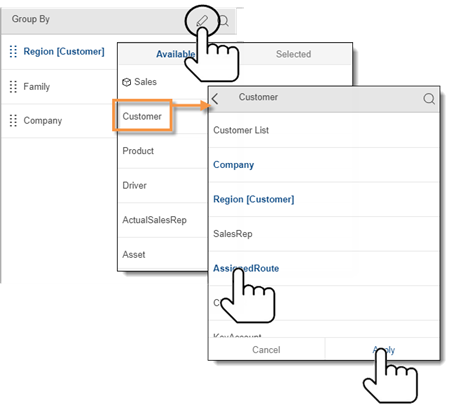 |
 .
.
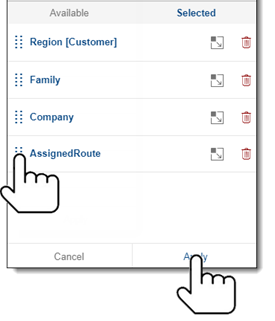
|
This goes back to a list of selected attributes. Notice that the new attribute is added as the last By.
|
|
Option 2: Search for an attribute
This will take you to the list of selected attributes where you can make the new attribute the 1st By. |
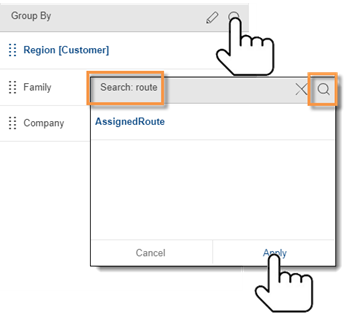 |
 .
.Change the data cube
Data cubes represent source bodies of data for various activities or conditions. You may need to change the data cube to access an attribute or measure associated with a different activity.
Tip: This may change the measures that are available. |
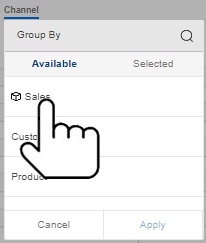 |
 ).
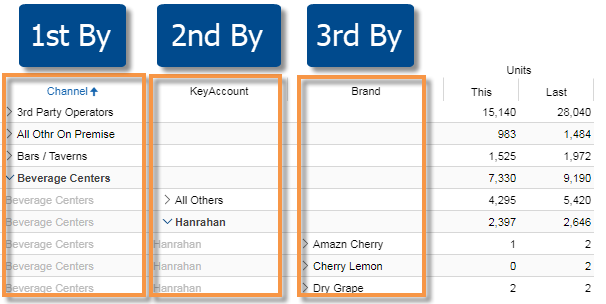
).Grid expansion
View multiple levels of data at once in grids. For example, expand the top-level dimension (1st By) into subgroupings for the next dimension (2nd By).
Expand rows individually
Tap on >, or tap the name and then choose to Expand.
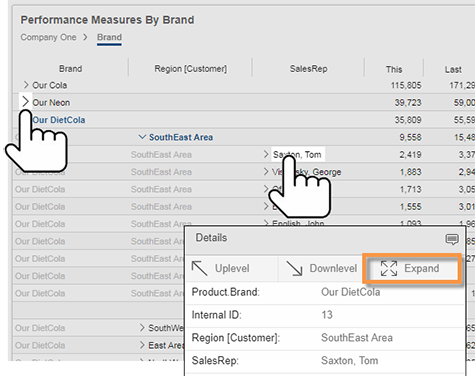
Tip: This method of expanding data is limited in a "flat view"; instead, you can turn on auto-expand (see below).
Expand all rows (auto-expand) in a grid
|
Tap the menu at the top the widget; then tap on Tip: The grid may organize the subgroupings under the parent level (with subtotals) or treat them independently (no subtotals), depending on the grid type. The grid type is built into the dashboard, but can be changed in explore mode. |
|
Graph expansion
In comparative, multi comparative, and mix graphs, you can expand dimensions to see data broken down further by the next dimension. To expand data in graphs, tap the menu at the top the widget; then tap on  to turn on auto-expand.
 |
Tip: The graph may organize the subgroupings according to the parent level (e.g., grouped bar chart or "sunburst" chart) or sort subgroupings independently (i.e. flat data), depending on the underlying grid type. The grid type is built into the dashboard, but can be changed in explore mode. |
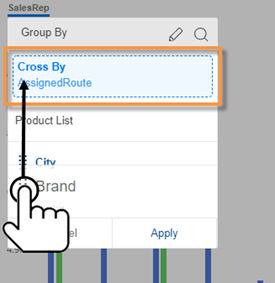
Cross By
|
Crosstab analyses show cross-sections of data for two attributes (Group By & Cross By). To select the Cross By, tap the menu at the top of a Crosstab widget; then drag the attribute's handle |
|