Change the analysis type
|
|
In explore mode, tap the
Tips: |
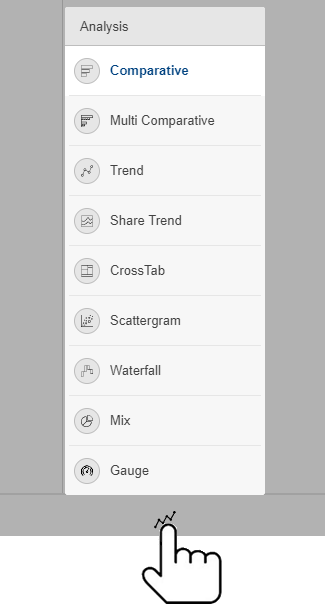
 button at the bottom of the screen and select an analysis type. See the following descriptions.
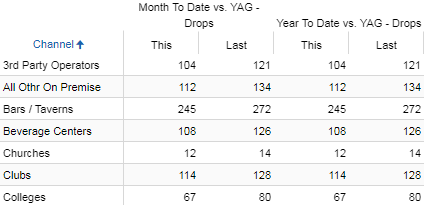
Comparative
|
Comparison of members for one or two date ranges |
|
Multi Comparative
|
Comparison of members for any number of date ranges; column filters may be applied to focus on specific subsets of the data. |
|
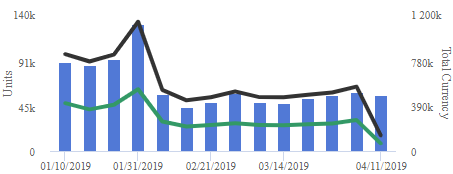
Trend
|
Trend over time for one or two date ranges |
|
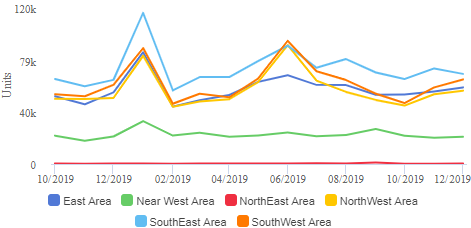
Share Trend
|
Comparison trend for multiple members |
|
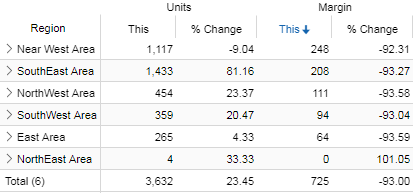
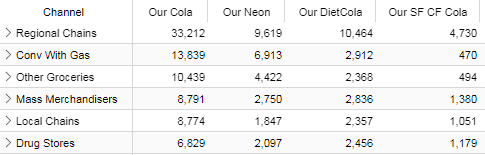
CrossTab
|
Comparison grid or graph by two attributes |
|
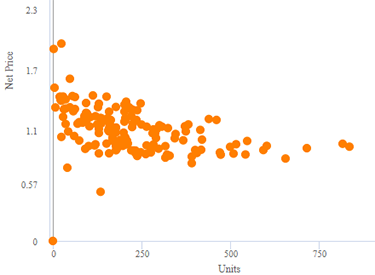
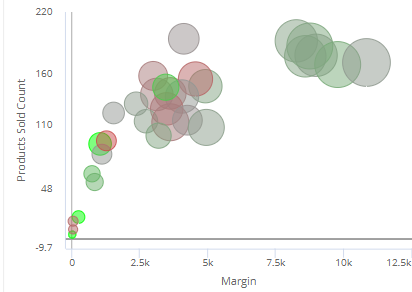
Scattergram
|
Plot of members (e.g., customers) along two axes to show correlations and outliers. Additional variables can be used to color and size the points (i.e., "bubble chart"). |
|
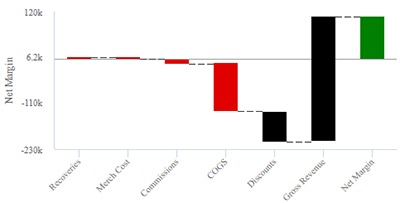
Waterfall
|
How the components of a calculated measure affect its make-up |
|
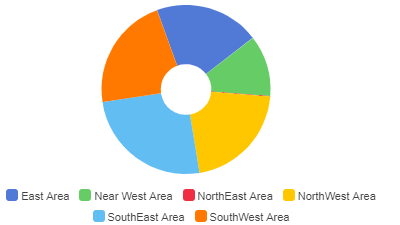
Mix
|
Percent of the total for multiple members |
|
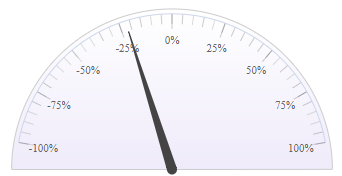
Gauge
|
A simple visual tool showing performance for a single measure |
|