Select dates
Dashboards show data for a range of dates (days, weeks, months, etc.) that can update automatically over time. Some widgets may also show an earlier date range to compare against. You may be able to change the dates depending on how the dashboard is configured. Date ranges are normally linked across a dashboard so that changing a date range in one widget affects other widgets.
In this topic:
Basic date selection
|
Tap on |
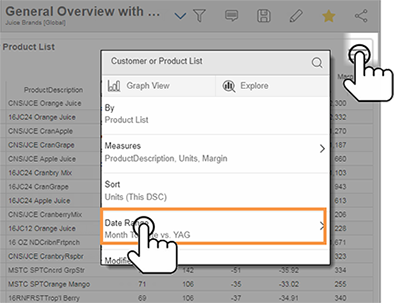 |
Quick-pick date options
|
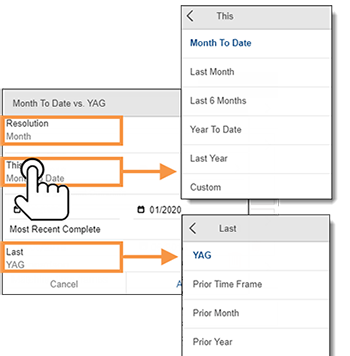
In the next pop-up, choose a resolution (day, week, month, etc.). Then, tap on This date range to choose from a variety of pre-configured options (month-to-date, last month, year-to-date, and so on) for the selected resolution. Repeat for Last date range if available. |
|
Custom start & end dates
To choose a custom start or end date, tap on it and choose from date options.

Date comparisons
You can add or remove a date range to compare against (depends on the widget type).
|
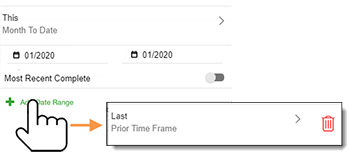
Compare two date ranges To add a comparison date range, tap on Add Date Range. Then choose date options for Last date range.
|
Single date range To look at a single date range, tap the
|
|
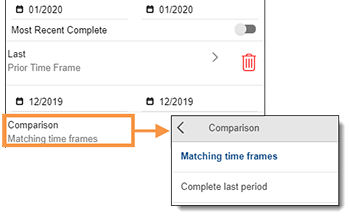
Comparisons of incomplete timeframes For a timeframe that isn't complete (e.g., current month), choose what to compare against.
|
|
 icon to remove the comparison date range.
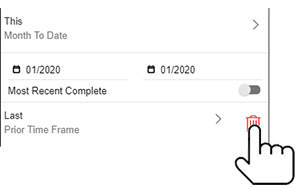
Date range selection in graphs
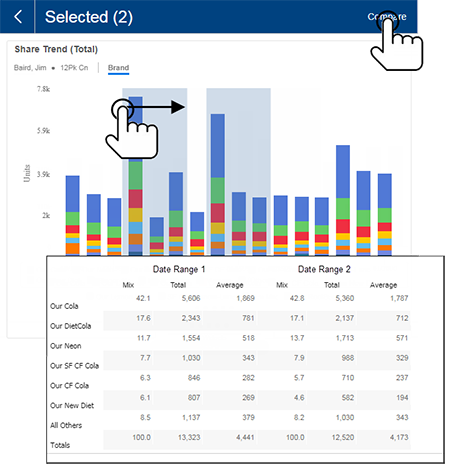
In most time-based graphs, you can drag across any date ranges and then tap on Compare to see details.
Additional methods of date selection
The following date selection tools may be built into the dashboard:
Date selector menu
|
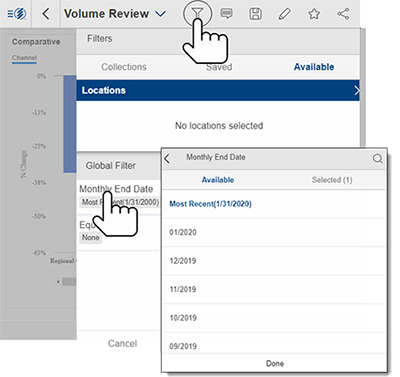
A date selector allows you to change the end date across all widgets in the dashboard. This menu must be pre-built into the dashboard and, if present, will be located in the filters panel. |
|
Date buttons
|
A dashboard may include pre-configured buttons to change the date with a single tap. |
 |